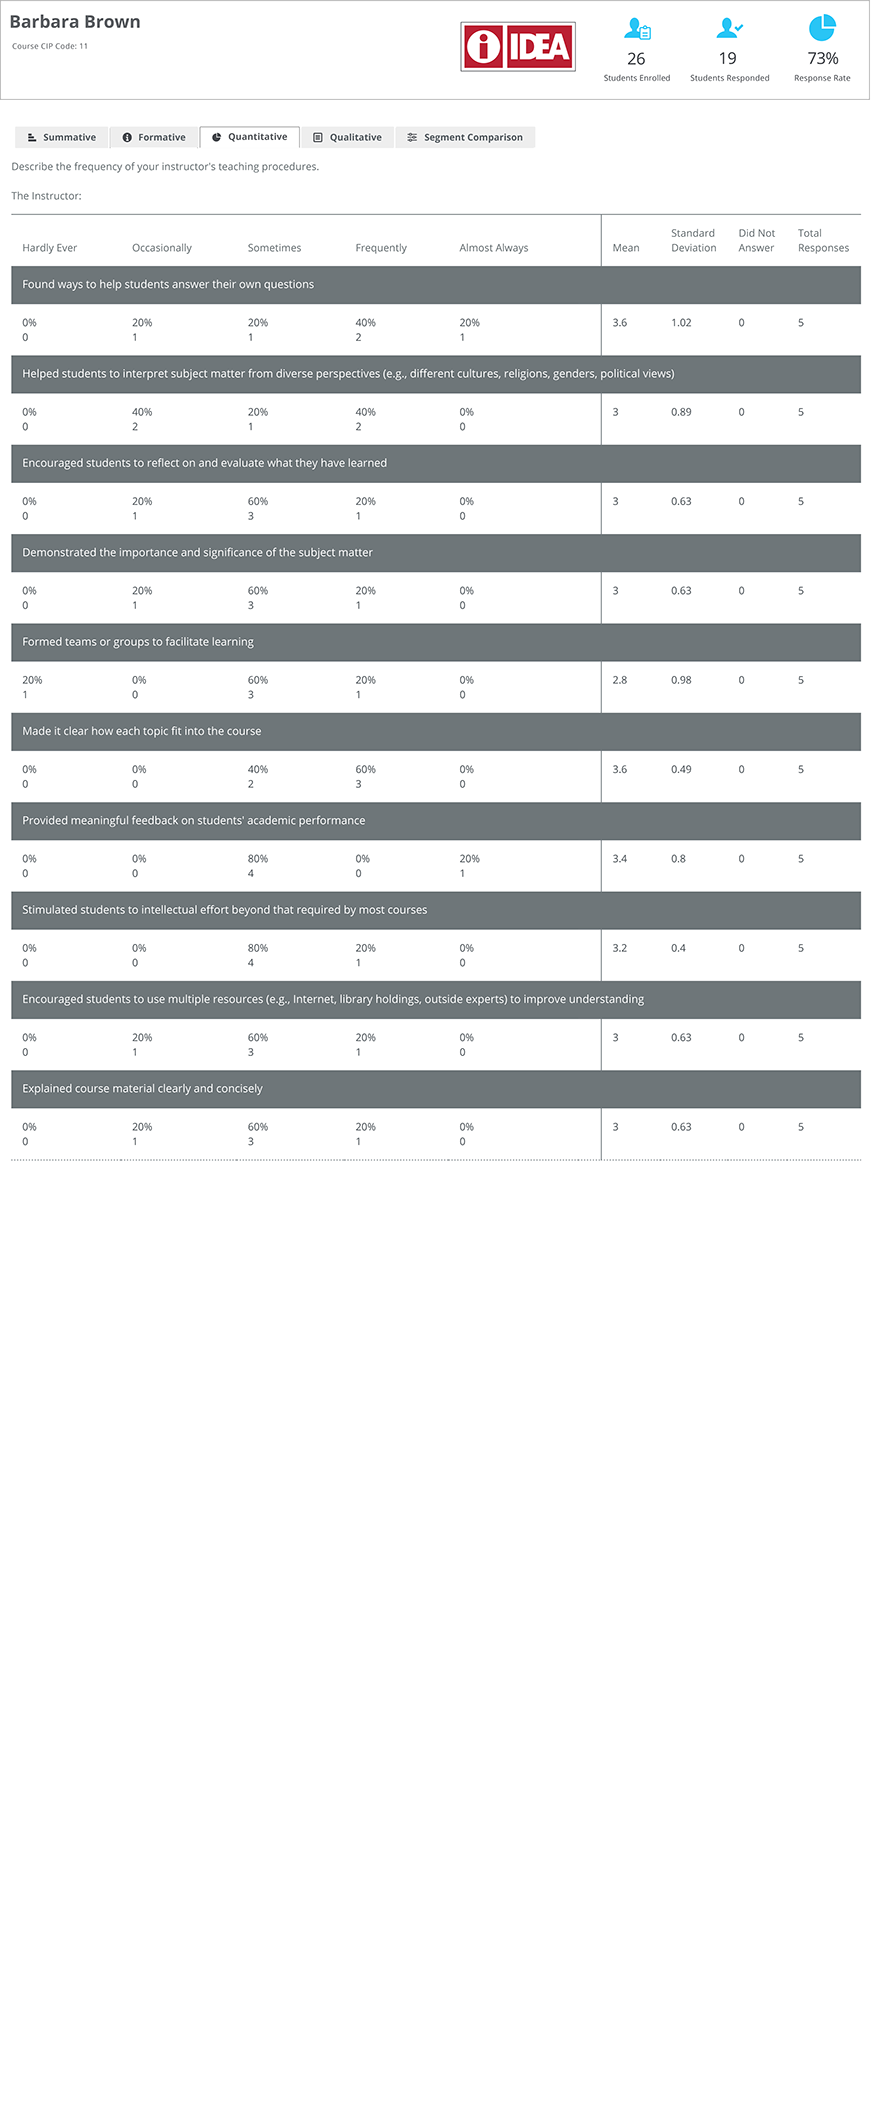
The Quantitative tab shows you the detailed distribution for each item on the survey as well as the mean and Standard Deviation for each.
Looking at the distribution can sometimes be enlightening. For instance, if a class is split with half rating a number of items on the high end of the scale and half on the lower end, it may indicate that there was an issue with a particular group of students. Perhaps students who came to this class well-prepared fared better with the instructor's approach, while those who were not prepared did not succeed with the instructor's approach. While the data here does not tell you that specifically, combined with other information, it may help you understand the overall feedback more effectively.
Back to Main page